
Ecology of the Northeast US Continental Shelf
Zooplankton
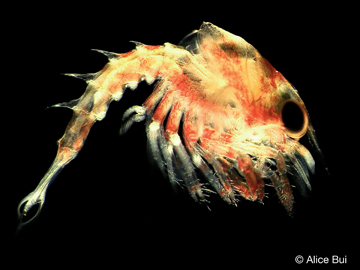
Zooplankton are small animals that are suspended in water and either drift with the currents or swim weakly. A very broad range of animals live their entire lives in the plankton and are referred to as holoplankton. Among these are the copepods, which are small (1-2 mm long) aquatic crustaceans, and are generally the most abundant zooplankton species (Figure 1). A number of other crustacean species are also components of the zooplankton including water fleas (Cladocerans), seed or mussel shrimp (Ostracods), opossum shrimp (Mysids), krill (Euphausiids (Figure 2), 'sand fleas' (Amphipods) 'true' shrimps (Decopods) and Isopods. A group of molluscs, the pteropods, are also planktonic; some species of pteropods have shells while others do not. A number of soft bodied or gelatinuous animals are planktonic including the Cnidaria (collectively referred to as jellyfish including hydroids, hydromedusa, siphonophores and scyphomedusa) and the Ctenophores (comb jellies; see Figure 3). Arrow worms (or Chaetognaths --literally spine jaws) are another group of invertebrates that are planktonic and are formidable predators on other zooplankton. Several groups related to other Chordates (animals with backbones) are also holoplanktonic including larvaceans and thaliaceans (salps).
Zooplankton play an important role in marine food webs, acting as carriers of energy from phytoplankton to higher trophic levels including fish, whales, crabs, shrimp, sea turtles and birds. In general, phytoplankton convert carbon dioxide and water into oxygen and organic carbon using energy from the sun (See Phytoplankton and Primary Production). Zooplankton graze on phytoplankton and the conversion of energy from plants to herbivorous zooplankton and other species is referred to as secondary production. Zooplankton are in turn eaten by other organisms, passing energy to higher and higher trophic levels. The details of marine food webs are more complicated than presented here, but basically, zooplankton are the link between plant production and higher trophic levels, much like cows are the link between grass and humans. We know much more about smaller, hard bodied zooplankton, such as copepods, because these animals are easily captured in plankton nets. We know less about larger and soft bodied zooplankton such as euphausiids and jellyfish. These "underknown" species may be very important in the trophic ecology of the ecosystem, and focused research is beginning to provide more information.
The Northeast Fisheries Science Center has been monitoring zooplankton on the Northeast U.S. Continental Shelf Large Marine Ecosystem (NES LME) for more than forty years. Two principal approaches are used. 1) Merchant vessels tow a continuous plankton recorder along their commercial route. This plankton recorder catches large phytoplankton and zooplankton, which are then identified and enumerated in the laboratory. A route between southwest Nova Scotia and Boston has been sampled since 1961 and a route between Newark and Bermuda has been sampled since 1974. 2) Research vessels surveys have been conducted since the late 1960's. During these surveys, fine mesh (0.33 mm) plankton nets are deployed. Again, the zooplankton captured are identified and enumerated in the laboratory. Sampling during the period from 1977 to 1987 - the MARMAP Decade - was intensive and provided one of the best views of the structure and function of any large marine ecosystem on the globe. Current sampling is scaled back from the MARMAP decade, but involves monthly continuous plankton recorder transects along the two routes and shelf-wide research vessel sampling six to seven times per year.
Seasonal and Spatial Trends
 Jan-Feb |
Mar-Apr |
May-Jun |
Jul-Aug |
Sep-Oct |
Nov-Dec
Jan-Feb |
Mar-Apr |
May-Jun |
Jul-Aug |
Sep-Oct |
Nov-Dec
Given the diversity of zooplankton (> 100 species), it is difficult to generalize seasonal and interannual trends - the dynamics of individual species can be very different. One measure of abundance that has been used is the total volume of material (or biovolume) caught in zooplankton nets, which have a very fine mesh (0.33 mm). Biovolume is used as a rough measure of secondary production. There is a marked seasonal trend in biovolume. In winter (Jan.-Feb.), biovolume is low along the entire shelf, with slightly elevated levels inshore in the southern Middle Atlantic Bight and on the peak of Georges Bank (Figure 4). In the early spring (Mar.-Apr.), biovolume is higher across most of the shelf relative to winter and is very high in Massachusetts Bay and on Georges Bank and Nantucket Shoals. Biovolume continues to increase shelf-wide in the late spring (May-Jun.), with high values on Georges Bank, Nantucket Shoals and along the outer southern New England shelf. These patterns are generally interpreted as the zooplankton response to the spring bloom of chlorophyll. Biovolumes remain high across most of the shelf during summer (Jul.-Aug.). In the early fall (Sept.-Oct.), biovolumes start to decrease on the outer shelf throughout the ecosystem, but the inner Middle Atlantic Bight remains an area of high biovolumes. In the late fall, biovolumes continue to decrease throughout the ecosystem, but biovolumes in the inner Middle Atlantic Bight shelf remains relatively high.
 Jan-Feb |
Mar-Apr |
May-Jun |
Jul-Aug |
Sep-Oct |
Nov-Dec
Jan-Feb |
Mar-Apr |
May-Jun |
Jul-Aug |
Sep-Oct |
Nov-Dec
One of the most important zooplankton species on the shelf is the copepod Calanus finmarchicus. This species is an important food source for many species in the ecosystem including fish larvae and juveniles as well as right whales. During winter, C. finmarchicus is found in low abundances, but relatively higher abundance in the Gulf of Maine than elsewhere in the ecosystem (Figure 5). In the early spring, abundances of Calanus finmarchicus increase throughout the ecosystem, but are highest in the shallower portions of the Gulf of Maine, on Georges Bank and on Nantucket Shoals. Abundance continues to increase into late spring, with high abundance throughout the Gulf of Maine, Georges Bank, the Southern New England shelf and the outer Middle Atlantic Bight shelf. During summer, early fall, and late fall, abundances decreases throughout the ecosystem with areas of relatively high abundance slowly contracting into the Gulf of Maine (Figure 5).
 Jan-Feb |
Mar-Apr |
May-Jun |
Jul-Aug |
Sep-Oct |
Nov-Dec
Jan-Feb |
Mar-Apr |
May-Jun |
Jul-Aug |
Sep-Oct |
Nov-Dec
Other important members of the copepod community of the NES LME include two species of the genus Pseudocalanus, two species of Centropages, and Temora longicornis. Pseudocalanus spp. is another abundant copepod taxa and a dominant food source for larval cod. There are actually two species of Pseudocalanus in the ecosystem: P. moultoni and P. newmani), but distinguishing between them is extremely difficult by visual examination alone. Their interannual abundance patterns are similar to Calanus finmarchicus, but Pseudocalanus spp. are found in shallower water. During winter Psuedocalanus are low in abundance and found in the shallower regions of the Gulf of Maine, on Georges Bank, on the Southern New England Shelf, and on the inner Middle Atlantic Bight Shelf (Figure 6). Abundances increase from early to late spring and from inshore to offshore and from the south to the north. During the summer, early fall, and late fall abundance decreases and contract into the shallower portions of the Gulf of Maine (Figure 6).
There are two common species of Centropages in the ecosystem. One species, C. hamatus, is primarily restricted to the inner Mid-Atlantic and southern New England as well as Georges Bank. This species is most abundant late spring and early summer in the Mid-Atalntic Bight and through the fall on Georges Bank (Figure 7). The second species, C. typicus, is much more widespread in the ecosystem and in abundant throughout the Middle Atlantic Bight in winter, spring and early summer, and is abundant in the Georges Bank/Gulf of Maine region in the summer and fall (Figure 8).
 Jan-Feb |
Mar-Apr |
May-Jun |
Jul-Aug |
Sep-Oct |
Nov-Dec
Jan-Feb |
Mar-Apr |
May-Jun |
Jul-Aug |
Sep-Oct |
Nov-Dec
 Jan-Feb |
Mar-Apr |
May-Jun |
Jul-Aug |
Sep-Oct |
Nov-Dec
Jan-Feb |
Mar-Apr |
May-Jun |
Jul-Aug |
Sep-Oct |
Nov-Dec
 Jan-Feb |
Mar-Apr |
May-Jun |
Jul-Aug |
Sep-Oct |
Nov-Dec
Jan-Feb |
Mar-Apr |
May-Jun |
Jul-Aug |
Sep-Oct |
Nov-Dec
Temora longicornis is less abundant than the other species considered here. It is most abundant in inner shelf waters of the Middle Atlantic Bight and southern New England in early summer. Abundance declines through the summer into the fall. This species also occurs in shallow waters on Georges Bank and in the Gulf of Maine with peak abundances in these regions in the summer (Figure 9).
Interannual Trends
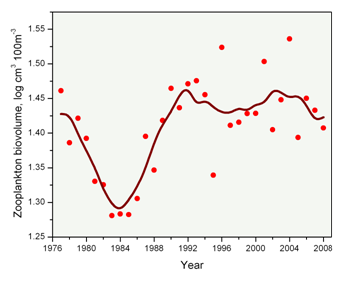
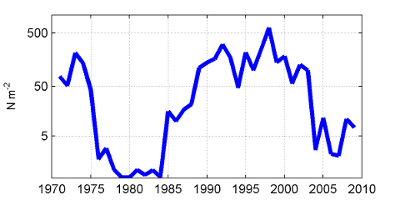
One measure of zooplankton abundance is the volume of material collected in the net (or the zooplankton biovolume) (Figure 10). This relatively simple indicator is related to the amount of zooplankton biomass. Levels of zooplankton biovolume have been remarkably consistent over the past 20 years with some inter-annual variability. In the early years of the time series, there was a marked drop and recovery in zooplankton abundance, with variable but near constant values since the late 1980s.
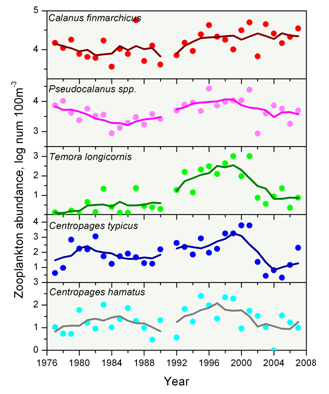
Individual copepod species can serve as indicators of these broader changes in overall species composition (Figure 11). During the spring, Pseudocalanus spp., Temora longicornis, Centropages typicus, and Centropages hamatus were all more abundant in the 1990s compared to the 1980s and the 2000s. Calanus finmarchicus was more abundant during the 1990s and 2000s compared to the 1980s.
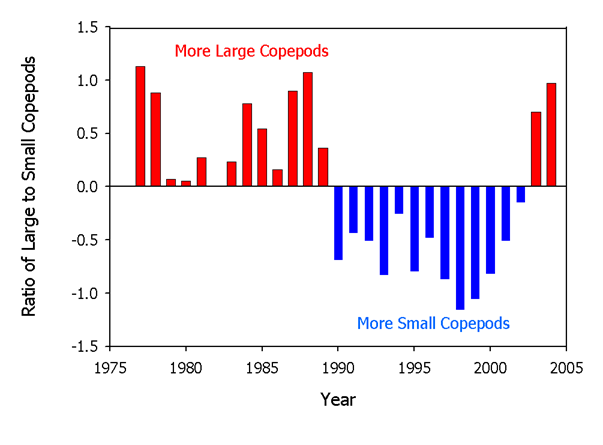
Combining these insights on individual species points to changes in the species composition of the zooplankton community over time. Specifically, several species of small copepods increased in abundance in the 1990’s resulting in an increase in total zooplankton abundance. The community composition changed again around 2000 consistent with the drop in zooplankton abundance in the fall (Figure 12).
Meroplankton
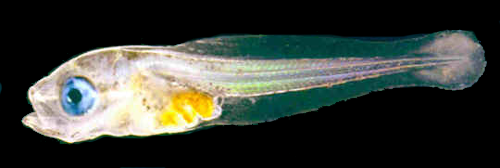
In addition to the broad range of animals that live their entire life in the plankton, a number of species use the plankton during specific parts of their life history (referred to as meroplankton). Most marine animals have complex life histories -- their life cycles are made up of morphologically distinct stages that use different habitats. A large number of marine invertebrates and fishes have planktonic larval stages including annelids (worms), molluscs (clams), gastropods (snails), bivalves (clams and scallops), decapods (crabs and shrimp), echinoderms (starfish and sea urchins) and most species of bony fish (Figure 13, Figure 14). In the NES LME, most resource species including fish, shellfish, and crustaceans, have planktonic early life stages.
The fact that many species have life stages that are part of the plankton has important ramifications to the dynamics of these species. For the life cycle to be completed, planktonic stages must survive to enter non-planktonic habitats. For example, a female yellowtail flounder releases hundreds of thousands of eggs into the water column. These eggs hatch into planktonic larvae, and thus both egg and larval stages are part of the plankton. After about 45 days, larvae settle to the bottom as juveniles; only those larvae that survive can complete the life cycle and thus processes acting in the plankton can have important effects on the abundance of most marine invertebrates and fishes, even if the adult stages are not planktonic.
The dynamics of zooplankton are therefore important for two main reasons. First, zooplankton are the intermediate step in the transfer of energy from phytoplankton to higher trophic levels. Second, most marine species are members of the zooplankton during at least part of their life cycle and survival during these planktonic stages is crucial to the population dynamics of most marine invertebrate and fish species.
Among the meroplankton, more than 700 species of fishes have larval stages that are found in the NES LME. Obviously, there are a complex set of species specific patterns in distribution and abundance - far too many to include here. However, these data provide important information regarding the status of the ecosystem, as well as information pertaining to specific species. For example, the distribution of Atlantic herring larvae demonstrates that there are two spawning groups in the Georges Bank region: one on Nantucket Shoals and one on northeastern Georges Bank. Larvae from these two groups mix after about two weeks. This type of information is useful to stock identification and the definition of Essential Fish Habitat. Further, the abundance of Atlantic herring larvae through time provides additional evidence of the recovery of the stock since the late-1980s (Figure 15). These data are important because they show that Atlantic herring spawning has increased in the Georges Bank area providing additional evidence that stock rebuilding efforts worked.
Further Reading
Durbin, E.G. and A.G. Durbin.1996. Zooplankton dynamics in the Northeast Shelf Ecosystem. In: Sherman, K., N. Jaworski, and T.J. Smayda (eds.) The Northeast Shelf Ecosystem: Assessment, Sustainability, and Management. Blackwell Science, Cambridge pp. 129-152.
Head, E.J.H., Pepin, P. 2010. Spatial and inter-decadal variability in plankton abundance and composition in the Northwest Atlantic (1958–2006). Journal of Plankton Research, 32:1633-1648.
Kane, J., Zooplankton abundance trends on Georges Bank, 1977-2004. ICES Journal of Marine Science, 2007. 64(5): p. 909-919.
NOAA (1988) An analysis and evaluation of ichthyoplankton survey data from the Northeast Continental Shelf ecosystem, NOAA Technical Memorandum NMFS-F/NEC-57
Sameoto, D. (2004) Northwest Atlantic Plankton Trends 1959–2000, Canadian Science Advisory Secretariate, Research document 2004/073
Sherman, K., W.G. Smith, J.R. Greeen, E.B. Cohen, M.S. Berman, K.A. Marti, and J.R. Goulet. 1987. Zooplankton production and the fisheries of the Northeastern shelf. Chapter 25 . In: (Backus, RH, ed.) Georges Bank. Cambridge, MA: MIT Press; p. 268-282.
For more information, contact Jon Hare