
Ecology of the Northeast US Continental Shelf
Fish and Squid
Fishes represent the most diverse vertebrate group with approximately 18,000 known living marine species (vertebrates are animals with backbones). An additional 13,000 living fresh water fish species have been catalogued to date. Collectively, fish species outnumber all other vertebrate groups combined in terms of the total number of living species (species richness). In the Northeast U.S. Continental Shelf Large Marine Ecosystem (NES LME), more than 500 species of marine and diadromous fish have been recognized. Diadromous fish such as salmon, shad, river herring etc. migrate between marine and freshwater systems in movements often linked to reproductive behavior. Most fish species in our region, as in many other parts of the world ocean, are teleosts (or bony fishes). However cartilaginous fishes such as the sharks, rays and skates (elasmobranchs) are both ecologically and economically important.
Fish have served as an important source of sustenance throughout human history. The earliest known fishing implements in archeological sites in Africa are over 90,000 years old. Fish have also served as an important catalyst for trade and exploration. European fishing activities in North America were underway well before extensive colonization began. Fishing later played a dominant role in the economy of the newly established colonies in the 17th century. Iconic species such as Atlantic cod (Figure 1) were critically important in establishing fishing as America’s ‘first industry’ (see the Economics module at this site).
In this section, we focus on the characteristics of fish communities of the NES LME as a whole rather than on individual fish species. For excellent summaries of the status of individual fish species in this and other regions, see NOAA's FishWatch.
An ecological community is a group of co-occurring species in a specified area. Often, communities are defined broadly by taxonomic affinities and we identify fish or sea bird communities etc. In turn, finer levels of resolution may be used to identify groundfish communities, elasmobranch communities and so on within the broader fish community. In some cases, we may make distinctions according to habitat, feeding preferences or other factors (see below). Species within and among communities may be linked by biological interactions such as predation or competition.
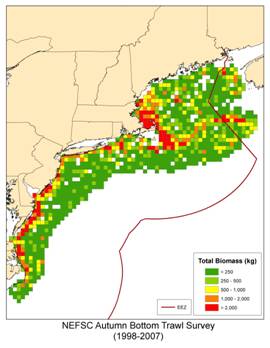
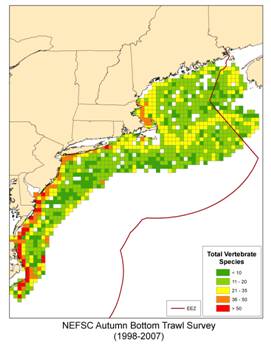
The distribution of fish in terms of biomass (total weight) and number of species is not uniform throughout our region (Figure 2). We see concentrations of both biomass and species richness among subregions of the coast, along topographic features, and other characteristics. Total biomass is high in the nearshore regions of the mid-Atlantic, the western Gulf of Maine, and the northern edge of Georges Bank (Figure 2a). The pattern of species richness for fish shows a similar structure (Figure 2b).
Types of Communities
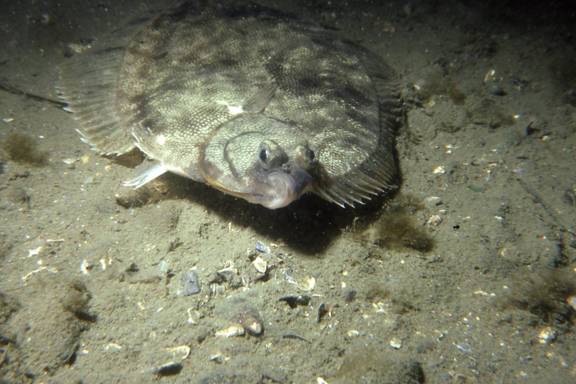
The species comprising a community and those targeted by a fishery can be characterized by how they are partitioned into different habitats. For example, demersal fish (species such cod, haddock, and flounders; see Figure 3) are found in near-bottom waters or associated with the seabed and associated structures (see also Figure 1). In contrast, pelagic fish (species such as Atlantic herring, river herring such as alewives and mackerel) are typically found higher in the water column.
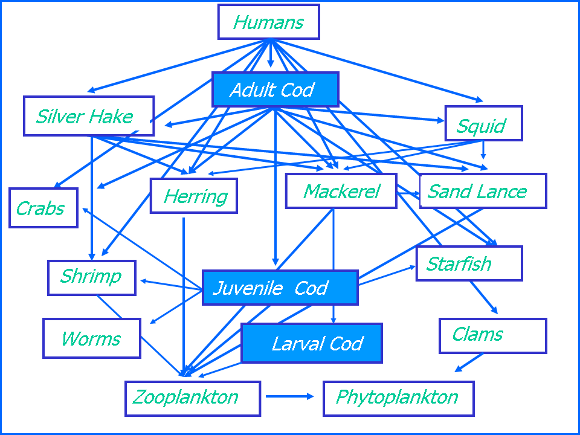
A commonly employed alternative classification combines species according to their feeding preferences (Figure 4). These include fish that principally feed on planktonic prey (planktivores), those that prey on organisms on or in the bottom sediments (benthivores) and species that prey on other fish (piscivores). In reality, fish often occupy different positions in the food web (or trophic levels) at different points in their life cycle. For example, most larval and juvenile fish prey on plankton and smaller food items in general. As the fish increase size, some species such as small pelagic fish (herring, mackerel. butterfish and others) remain plankton feeders while others undergo a transition to different feeding patterns. Many piscivorous fish typically feed at lower trophic levels while young and feed progressively on larger prey items including other fish as they increase in size and age. For example, juvenile cod principal prey on larger zooplankton species and benthic invertebrates including crabs and echinoderms while larger, older cod contain an increasing representation of other fish in their diets.
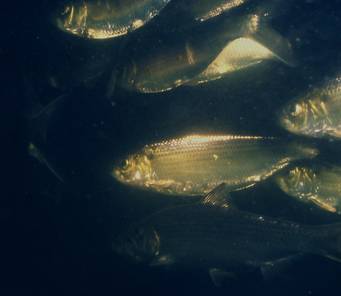
Fish that are consumed by a broad spectrum of predators are called “forage” fish (Figure 5). Natural predators such as other fish, marine mammals and seabirds often eat more forage fish than humans catch. For forage species such as Atlantic herring, the amount consumed by predators is now substantially higher than the harvest itself. The amount of herring consumed by natural predators has increased as the abundance of this species has increased. Many predators are opportunistic and will feed on the most abundant prey items they encounter. In recent years, marine mammals and fish consumed roughly equal amounts of herring, with far lower consumption by seabirds and apex predators such as tunas and billfish. We have also seen the relative importance of different predator groups change with time. For example, in the early 1990s, the dominant natural predators of herring were other fish, accounting for 70% of the natural predation and consuming nearly three times the herring eaten by marine mammals.
Because forage species such as herring, mackerel and others are so important as prey, consideration of ecosystem based fisheries management will entail an evaluation of the food requirements of these predators to maintain a balanced ecosystem while also considering the role of forage fish as predators of planktonic organisms including the eggs and larvae of other fish species.
Trends in Species Groups
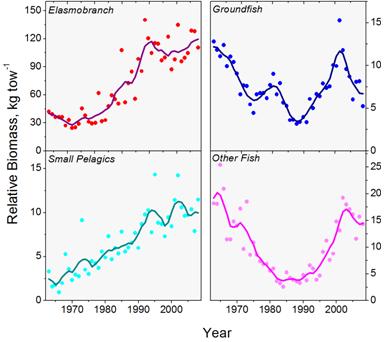
Dramatic changes in the relative abundance of different species groups have been observed over time. During the early 1960s, the abundance of northeastern groundfish species began a period of sharp decline as a result of overexploitation with the advent of fishing by the factory trawlers of the distant water fleets. Under a number of new management actions by the early 1990s, some stocks have started to improve with a recent peak in the early part of this decade (Figure 6). Management actions implemented at the end of 1994 included the establishment of large-scale closed areas, restrictions on the days-at-sea allowed for each vessel, and gear regulations such as increased mesh-size. Small pelagic fishes, notably herring and mackerel, also declined in the region under intensive exploitation by the distant water fleets in the 1960s. These species have since undergone a tremendous increase in abundance (Figure 6). During the period of decline for groundfish, a large-scale increase in abundance of certain elasmobranchs (dogfish and some skates) was observed.
Although the exact mechanisms underlying this increase have not been determined, one suggestion is that overall declines in abundance in certain parts of the ecosystem have resulted in the release of food and/or space that the dogfish and skates could then use. These small elasmobranchs began to decline starting in the mid- to late 1980s as fishing pressure on these species increased. Because elasmobranchs produce many fewer young than most other fish, and they tend to become mature at older ages, they are vulnerable to overexploitation. The increase in the small pelagics is thought to be related both to a decrease in fishing pressure after the foreign fleets were excluded after the adoption of the 200 mile limit, and possibly a release in feeding pressure by at least some predators. These changes in the composition of the fish communities and the relative importance of different species groups raise questions about whether the changes are reversible if we reduce overall fishing pressure or whether more direct manipulations might be needed. In some cases, the shifting patterns of fishing pressure on different groups over time may have strongly influenced patterns of decline and recovery.
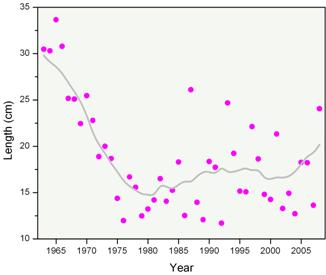
We can also characterize the fish community and species of commercial and ecological significance with respect to their size distribution. An indicator of overall mean length, taken from the lengths of all finfish species caught in fisheries independent surveys, shows the size composition of the entire fish community (Figure 7). There was a decline of almost one half from the 1960s to mid 1970s from an average fish size of approximately 30 cm (~12 inches) to 17 cm (~6 ½ inches). There has been some change thereafter but effectively the mean size of fish has been between 15 and 20 cm for the past 30 years, with only recent signs of an increasing trend. This would indicate that the average size of fish in this entire ecosystem has declined. It appears that fishing pressure on larger organisms has resulted in declines in their average size while there has also been an increase in smaller bodied fish (particularly small pelagic fish such as herring and mackerel; see Figure 7).
The trophic level of a species is an important aspect of understanding not only the size of species in an ecosystem, but also the transfer of energy in the system. We can determine the trophic level of a species from examining its diet. It is then possible to determine the mean trophic level in the sampled community by weighting the trophic levels of individual species by their abundance (biomass) and averaging over all species.
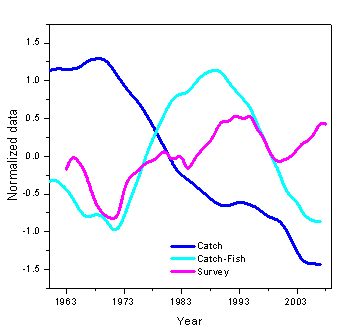
The mean trophic level is an indicator of how much energy is transferred to species feeding higher up in the food web. The average trophic level of species captured in the NEFSC bottom trawl surveys has remained relatively stable over time but has varied from lower values in the late 1960s to mid 1980s and an increasing trend in recent years. Interestingly, however, the mean trophic level in the total catch has decreased substantially, in large measure as a result of the increasing relative importance of shellfish (particularly species such as scallops) which feed on phytoplankton and detritus and are therefore very low in the trophic structure (Figure 8). If we look at the mean trophic level of the fish catch only (and therefore more directly comparable to the species represented in the bottom trawl surveys), the correspondence is much closer but still shows a marked decline starting in the early 1990s.
Apex Predators
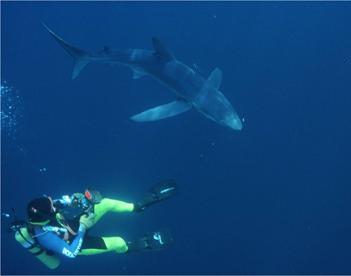
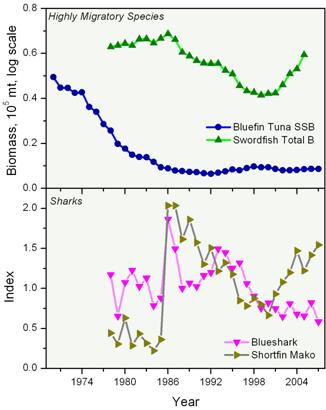
Species such as tunas, swordfish, and sharks that feed at the top of the food web are called apex predators (Figure 9). Many of these species are also intensively exploited. Trends in abundance of selected apex predator species found in the North Atlantic are shown in Figure 10. These estimates are for the entire north Atlantic, but are indicative of trends for these species in our region where they reside for at least part of the year.
Dramatic declines in species such as bluefin tuna (Figure 10) have elicited considerable concern. The bluefin tuna in particular has been the focus of international conservation efforts. Bluefin biomass has steadily declined since the 1970s and 1980s to currently low values. This species was recently proposed for listing under the Convention on International Trade in Endangered Species. Swordfish declined in abundance through the 1990s but more recent estimates indicate some recovery in biomass levels. Both bluefin tuna and swordfish are highly prized in the marketplace and the bluefin commands extremely high prices in Japanese markets for the highest quality fish to be used as sashimi.
As with smaller elasmobranchs, the low reproductive output of large sharks and their advanced age at maturation make them particularly vulnerable to over-exploitation. The status of large sharks in general has therefore also generated marked concern over their sustainability. Estimates of the recent abundance of the blue shark in this region have declined steadily since the 1990s. The abundance of shortfin mako, perhaps the most highly sought of the large sharks used for human food, was extremely low from the mid 1970s-1980s and increased sharply before again declining over the decade and a half from 1985-2000. A more recent increase has been noted for this species (Figure 10).
Fisheries
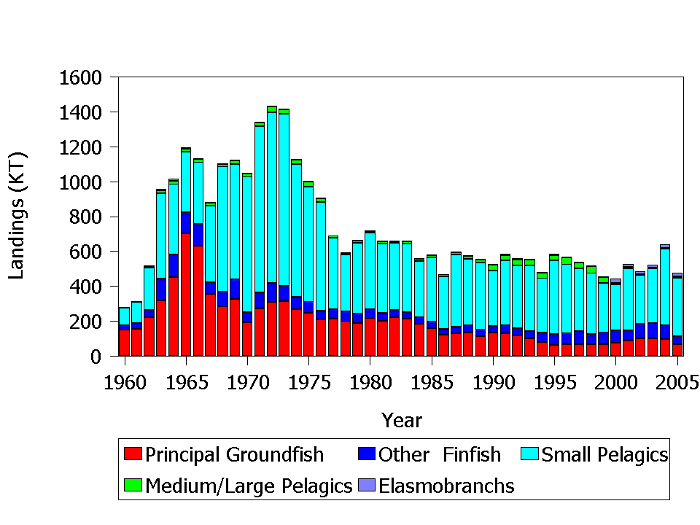
Total landings for major groups of fishes from the NES LME have generally declined over the last four decades (Figure 11). A major intervention occurred with the appearance of foreign factory trawlers off our coast in the early 1960s and extending until the enactment of the 200 mile limit in 1977. Landings of groundfish (Atlantic cod, haddock, silver hake, yellowtail flounder etc.) and small pelagic fishes (primarily Atlantic mackerel, herring, and menhaden) peaked in the mid 1960s to the mid 1970s during a period of heavy fishing by foreign distant water fleets. Groundfish landings peaked at over 700,000 tons in 1965, while small pelagics reached nearly one million tons in 1973 (Figure 11). Serial depletion of groundfish occurred very rapidly and landings declined to about 30% of the peak by 1978. Landings of small pelagic fishes also declined to about 31% of their peak value by 1984 due to the collapse of the Georges Bank herring stock and a severe decline in Atlantic mackerel. Groundfish landings have continued to decline since the mid 1970s due to severe overfishing and more recently regulatory intervention to rebuild depleted stocks; currently they are a minor component of total system removals. Small pelagic landings remain relatively robust, averaging about 360,000 tons from 1977-2007. Recovery of the Atlantic herring and mackerel stocks during the 1980s and sustainable landings of Atlantic menhaden are responsible for this stable trend. Landings of other finfish (redfish, Atlantic croaker, black sea bass, etc.) have been relatively stable during the last several decades.
Squid
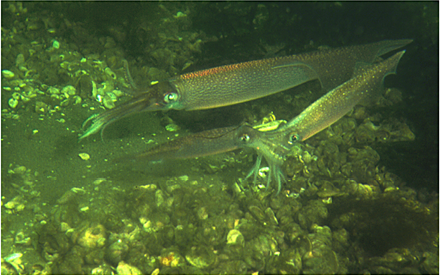
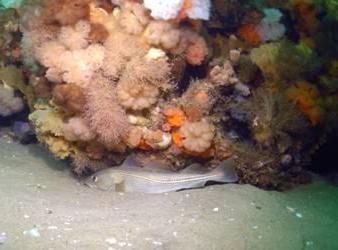
Two species of squid are important members of the pelagic community on the Northeast Continental Shelf. The longfin squid (Loligo paeleii) is principally distributed in the Northwest Atlantic from Georges Bank to Cape Hatteras. This species has supported commercial fisheries (including bait fisheries) for over a century. The shortfin squid (Illex illecebrosus) is broadly distributed from Florida to Newfoundland and undertakes extensive migrations. Both species are important prey items for broad spectrum of predator species including marine mammals, fish, and marine birds. Squid also prey on some fish species. Shortfin squid have a protracted spawning period and are known to spawn in the Mid-Atlantic Bight. Spawning may also occur on the continental slope and in Gulf Stream waters. This species dies following mating. Shortfin squid typically mate in nearshore and coastal waters (Figure 12) and like Illex, spawn throughout the year.
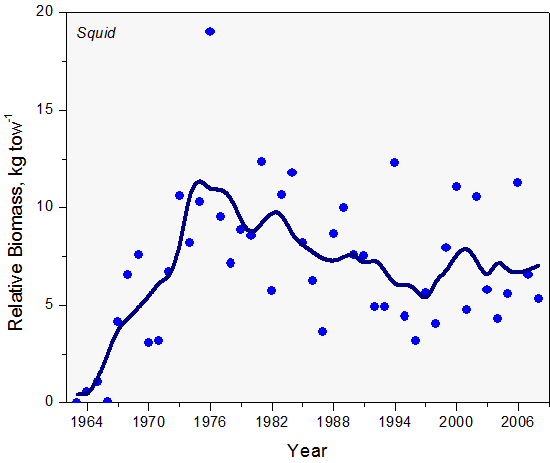
Both Illex and Loligo have short life spans of up to one year. The abundance patterns of annual species of this type are often highly variable. The distribution and abundance of both shortfin and longfin squid appears to be particularly influenced by prevailing oceanographic conditions. The combined abundance of both squid species increased from a low during the early 1960s, peaking in the mid 1970s and then fluctuated widely without discernible trend (Figure 13).
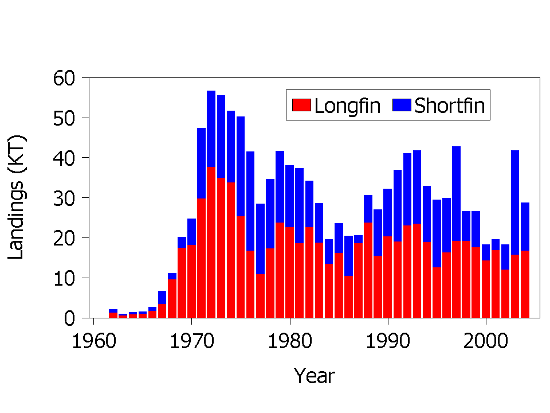
Squid landings in space and time strongly reflect seasonal movement patterns of the two species. During summer through fall, shortfin squid are taken by otter trawl on the shelf in the Mid-Atlantic Bight region near the edge of the continental shelf. Longfin squid fishery occurs primarily in Southern New England and Mid-Atlantic waters, with some catches taken along the edge of Georges Bank. Fishing is principally in offshore waters during October through April and inshore during May through September, following the annual distribution patterns of this species. As with Illex, the dominant mode of fishing is by small-mesh otter trawlers, but pound nets and fish traps are also used when longfin squid are located in nearshore coastal waters. Both species were important components of the distant water fleet catches in offshore waters from the mid 1960s to the mid 1980s and catches from the distant water fleets and total landings from both species peaked during this period (Figure 14) Foreign fishing in U.S. waters has been prohibited since 1987 on the Northeast Continental Shelf.
Further Readings
Azarovitz, T. and M. Grosslein. 1987. Fishes and squids. Chapter 30. In: (Backus, RH, ed.) Georges Bank. Cambridge, MA: MIT Press; p. 315-346.
Brown, B.E. 1987. The fishery resources. Chapter 47. In: (Backus, RH, ed.) Georges Bank. Cambridge, MA: MIT Press; pp. 480-493.
Casey, J.G., J.J Hoey, and M.D. Grosslein. 1987. Large pelagic predators. Chapter 32. In: (Backus, RH, ed.) Georges Bank. Cambridge, MA: MIT Press; p. 351-355.
Collette, B. and G. Klein-Macphee. 2002. Fishes of the Gulf of Maine. Smithsonian Institution Press, Washington, D.C. 748pp.
Fogarty, M.J., M.P. Sissenwine, and M.D. Grosslein. 1987. Fish Population Dynamics. Chapter 48. In: (Backus, RH, ed.) Georges Bank. Cambridge, MA: MIT Press; pp. 494-507.
Grosslein, M., R. Langton, and M. P. Sissenwine. 1980. Recent fluctuations in pelagic fish stocks of the northwest Atlantic, Georges Bank region, in relation to species interactions. Rapports et Proces-Verbaux des Reunions du Conseil International pour l’Exploration de la Mer 177:374-404.
Link JS; Almeida FP. 2000. An overview and history of the food web dynamics program of the Northeast Fisheries Science Center, Woods Hole, Massachusetts. NOAA Tech. Memo. NMFS-NE-159, 60 pp.
Murawski S.A., J.J. Maguire, R.K. Mayo, and F.M. Serchuk. 1997. Groundfish stocks and the fishing industry. In: Boreman J., B.S. Nakashima, J.A. Wilson, R.L. Kendall (eds.) Northwest Atlantic groundfish: perspectives on a fishery collapse. American Fisheries Society, Bethesda, Maryland, USA.
Sissenwine, MP. 1987. Fish and squid production. In: Backus, R; Price, R; Bourne, D, eds. Georges Bank. Cambridge, MA: MIT Press; p. 347-350.
For more information, contact Michael Fogarty or visit the Population Biology Branch Webpage